Break-Even Point Calculator
Break-Even Point Calculator: Calculate Units & Revenue Targe
Business Break-Even Point Calculator: Map Your Path to Profitability
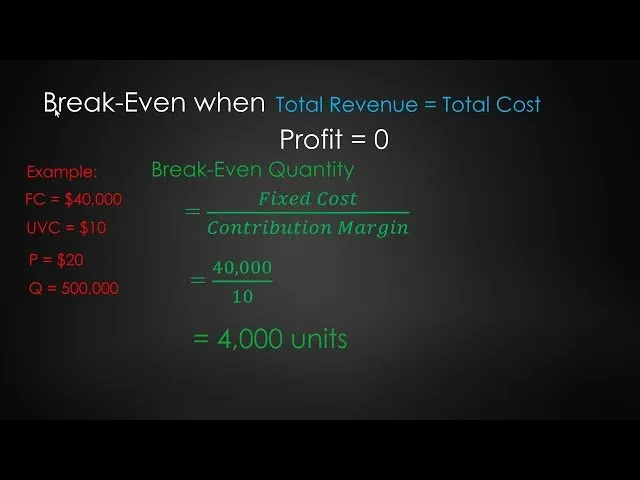
Before a business can generate net profit, it must reach its Break-Even Point (BEP)—the exact operating volume where total revenues equal total expenses. Knowing your break-even threshold allows you to determine how many physical units, digital licenses, or billable service hours you must sell each month just to keep the business solvent.
Our free interactive
The Anatomy of Break-Even Analysis

A comprehensive break-even model divides business expenses into two main categories:
Fixed Costs: Recurring operational expenses that remain constant regardless of production volume (e.g., office rent, administrative salaries, insurance, software hosting).
Variable Costs: Production expenses that scale directly with sales volume (e.g., raw materials, merchant transaction fees, shipping, sales commissions).
The Core Break-Even Formulas
Visualizing the Break-Even Chart
Revenue / Costs ($)
     ^                                         / (Total Sales Revenue)
     |                                        /
     |                                 [PROFIT ZONE]
     |                                      /
     |                                    *  <--- BREAK-EVEN POINT (BEP)
     |                                  /
     |  [LOSS ZONE]                   /
     |                              / ------------------- (Total Costs)
     |                            /
     |__________________________/____________________ (Fixed Costs)
     +--------------------------------------------------> Sales Volume (Units)
Break-Even Analysis Scenario Matrix
Consider a physical product business selling custom water bottles:
Fixed Overhead Costs: $12,000 per month
Selling Price: $30.00 per bottle
Variable Production Cost: $10.00 per bottle
Unit Contribution Margin: $30.00 - $10.00 = $20.00
Selling 601 units yields your first $20.00 of net operating profit. Selling 599 units results in a $20.00 operating loss.
How to Lower Your Break-Even Point
Renegotiate Overhead Expenses: Shift fixed software costs to usage-based models or renegotiate vendor contracts.
Optimize Unit Contribution Margins: Increase retail prices or source cheaper raw materials to widen your per-unit profit margin.
Audit Expense Data: Consult financial guidelines from the
U.S. Internal Revenue Service (IRS)
Sponsored — Affiliate
Amazon Business & Tech Offers

Estée Lauder Little Black Primer™ Tint. Amplify. Set.
$30.00

Amazon Fire TV Stick 4K Max with Alexa Voice Remote Pro
$84.98

Blink Video Doorbell + Outdoor 4 – Wireless Doorbell
$103.99

Dell XPS 13 OLED Review (2026): Is It the Ultimate Business Laptop for Executives?
$0.00

Starface Hydro-Star® Recovery Hydrocolloid Star-Shaped
$25.99

Apple AirTag (2nd Generation) - 4 Pack: Tracker for
$89.99
Prices and availability are accurate as of publication. We may earn a commission at no extra cost to you.
Share this article
Help others find it — share on your favorite network.
Comments & Reader Rating